ROAS Guide: Improving Return on Ad Spend, Layer by Layer
ROAS problems are almost always layered — fixing creative before feed and tracking issues wastes effort on the wrong layer entirely.
Vineeth N.A · 9 min read · Updated July 2026
Quick Answer
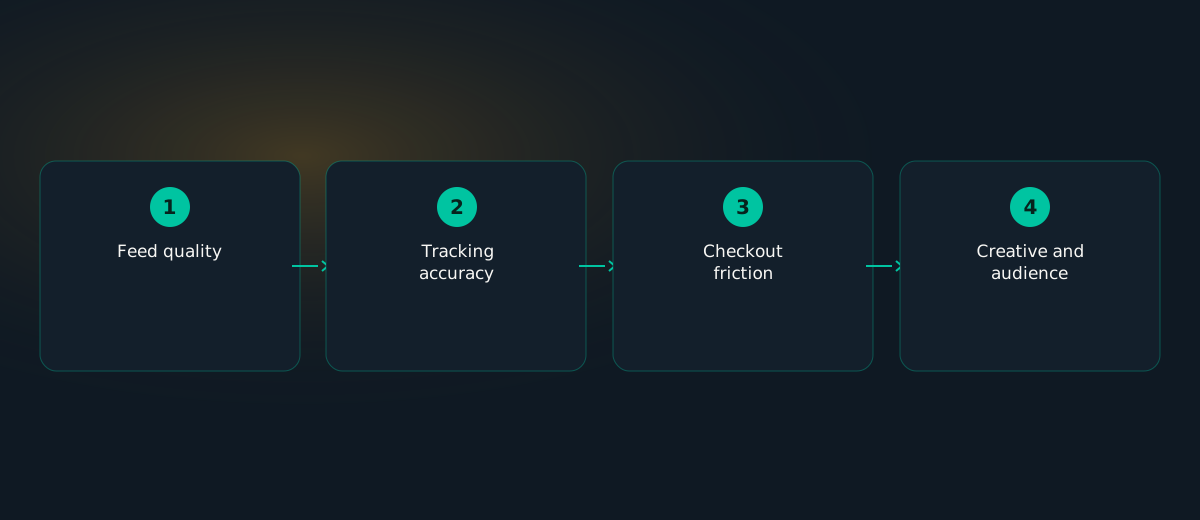
The Zephra Conversion Optimization Pyramid™
| Layer | Focus | Why it's ordered here |
|---|---|---|
| 1 (foundation) | Feed quality and tracking accuracy | Everything above depends on trustworthy data |
| 2 | Checkout and site experience | Traffic that converts poorly here wastes every dollar spent above |
| 3 | Creative and audience | Only meaningful to optimize once 1-2 are solid |
Break-Even ROAS: The Real Benchmark
Break-even ROAS = 1 ÷ profit margin
Example: 25% profit margin → break-even ROAS = 1 ÷ 0.25 = 4x. Below 4x, this specific product is losing money on ad spend alone before other costs.
"A good ROAS" isn't a fixed number like "4x" — it's whatever meaningfully exceeds your specific break-even point, which varies by product margin. A 3x ROAS can be excellent for a high-margin product and a loss for a thin-margin one.
Fixing Each Layer in Order
- Feed quality: confirm product titles, images, pricing, and availability are accurate and complete in your product feed — see Google Shopping Ads Guide.
- Tracking accuracy: confirm Pixel/Conversions API and Google Ads conversion tracking report real order value, not just a conversion count.
- Checkout friction: review cart abandonment rate and checkout steps — see Cart Abandonment Recovery.
- Creative and audience: only optimize this layer once the foundation is confirmed solid.
Reconciling Platform ROAS vs Real Accounting
Ad platforms often over-attribute conversions to themselves when multiple channels are running simultaneously, and reported revenue may not reflect returns, discounts, or true margin. Reconcile platform-reported ROAS against actual order and margin data monthly — a persistent, large gap between the two is itself a signal worth investigating.
Variations by Product Type
| Product type | ROAS consideration |
|---|---|
| High-margin, considered purchase | Lower ROAS can still be very profitable |
| Low-margin, high-volume | Needs a notably higher ROAS to be profitable at all |
| Subscription/repeat-purchase | Consider LTV-adjusted ROAS, not just first-order ROAS |
Case Study
An ecommerce brand was reporting a platform ROAS of 5x but seeing declining actual profitability, and initially focused on refreshing ad creative to improve the number further. An audit found the product feed had stale pricing for roughly 15% of the catalog, causing Google to serve ads for products at incorrect, outdated prices — driving clicks that bounced at checkout once the real price was shown. Fixing the feed data resolved the underlying issue; creative changes, which had been the initial focus, would not have addressed it at all.
Decision Matrix
| Situation | Check first |
|---|---|
| ROAS below break-even for a specific product | Feed accuracy and tracking for that specific product |
| Good ROAS reported, but real profitability declining | Reconcile platform ROAS against actual accounting data |
| High cart abandonment, moderate ROAS | Fix checkout friction before optimizing creative further |
Common Mistakes
- Optimizing creative or audience before confirming feed and tracking are solid.
- Using a fixed "good ROAS" number without calculating break-even for your actual margin.
- Trusting platform-reported ROAS without reconciling against real accounting data.
- Judging ROAS on a per-product basis without accounting for margin differences across the catalog.
Troubleshooting
ROAS looks fine but profitability is declining: reconcile platform-reported revenue against real accounting data, and check for return/discount impact.
ROAS dropped suddenly with no obvious cause: check feed quality first — a broken or stale feed is a common, easily overlooked cause.
Checklist
☐ Break-even ROAS calculated for actual product margins
☐ Feed quality confirmed accurate before optimizing creative
☐ Tracking confirmed to report real order value
☐ Platform ROAS reconciled against real accounting data monthly
FAQ
What's a good ROAS for ecommerce?
It depends on margin — calculate break-even ROAS (1 ÷ profit margin) and aim meaningfully above that.
Why does my ROAS look different in the platform vs my accounting?
Platforms over-attribute conversions and may not account for returns or true margin.
Should I fix creative or targeting first if ROAS is low?
Neither — check feed quality and tracking accuracy first.
You can diagnose this layer-by-layer using the guidance above.
Zephra checks feed quality and tracking accuracy automatically before ever touching creative or bids, and reconciles platform ROAS against real order data.
Start Free Audit →Sources & Further Reading
- Baymard Institute — 50 Cart Abandonment Rate Statistics — A meta-analysis of 50 independent studies on cart abandonment rates and causes.
- WordStream — 2026 Google Ads Benchmarks Report — Current cross-industry CPC, CTR, conversion rate, and cost-per-lead benchmarks.
- Meta Business Help Center — About the Learning Phase — Meta's own explanation of what the ad set learning phase is and why it exists.
Figures and platform mechanics referenced in this guide are cross-checked against the above as of publication; ad platform thresholds and benchmarks change over time, so confirm current figures directly with the source before making budget decisions.